If you’ve been following me for a while, you may have seen my earlier post about GitHub Agentic Workflows. That got me wondering: can I do something similar from an Azure DevOps pipeline?
The short answer is yes, although the plumbing is different. GitHub Agentic Workflows compiles a Markdown definition into a guarded GitHub Actions workflow. Azure DevOps does not have that same compiler. Instead, an Azure Pipeline can install GitHub Copilot CLI, authenticate it non-interactively, and run a prompt using the CLI’s programmatic mode.
I will start with a read-only commit review, then take it one step further with a more developer-oriented scenario: diagnosing a failed .NET test run. In both cases Copilot publishes a Markdown artifact. It will not edit code, push a branch, or quietly decide whether production is having a good day (that last one still belongs to us).
What We Are Building
I split the walkthrough into two standalone pipelines. They use the same Copilot credential and security boundaries, but you can run either one without first completing the other:
- Commit review: the smaller starting point for readers who are new to Azure Pipelines or Copilot CLI. A successful run finishes green and publishes
review.md. - Failed-build investigation: the developer-focused scenario. It runs the .NET tests, asks Copilot to explain a failure, publishes the evidence and report, then deliberately finishes red because the test still failed.
The first flow is straightforward:
- Azure Pipelines starts a fresh Ubuntu agent.
- The pipeline checks out enough Git history to compare the current commit.
- It installs Node.js 22 and GitHub Copilot CLI.
- Copilot reviews the current change using a prompt and a restricted set of tools.
- The response is stored as
review.mdand published as a pipeline artifact.
Microsoft-hosted agents are a good fit for a first test. Every job receives a fresh VM, and that VM is discarded after the job. If you use a self-hosted agent instead, the YAML is nearly identical, but you are responsible for cleaning its workspace, credentials, and Copilot state between runs.
Prerequisites
Before touching the pipeline, you need:
- An active GitHub Copilot subscription. If Copilot is assigned by an organization or enterprise, its Copilot CLI policy must also allow access.
- An Azure DevOps project with a GitHub connection (we follow the Microsoft guidelines to use repos from GitHub now - although you could clone my sample repo from the link more below into the ADO repos as well) and permission to create or edit a YAML pipeline.
- GitHub CLI on a trusted workstation so you can create the OAuth token used in this walkthrough.
- A pipeline agent that can reach GitHub and npm over HTTPS.
There is one detail worth calling out: System.AccessToken is an Azure DevOps job token. It can authenticate to Azure DevOps resources, but it cannot authenticate GitHub Copilot CLI. These are two different identity systems.
Step 1: Get the GitHub Token
For a headless environment, GitHub recommends authenticating Copilot CLI through an environment variable. Copilot CLI supports an OAuth token beginning with gho_, a user-owned fine-grained PAT beginning with github_pat_ and the Copilot Requests account permission, or a GitHub App user-to-server token beginning with ghu_. A classic ghp_ token is not supported.
I used the OAuth route for the working pipeline. On a trusted workstation, sign in interactively with the GitHub account that owns the Copilot seat:
| |
Then copy the stored OAuth token directly to the clipboard without printing it:
| |
Paste that value into the secret Azure DevOps variable in the next step. Treat it as a user credential, because that is exactly what it is. You can review or revoke the authorization later under GitHub Settings > Applications > Authorized OAuth Apps.
Note: This is different from the newer GitHub Agentic Workflows experience. Those workflows can use their built-in GITHUB_TOKEN with copilot-requests: write. An Azure Pipeline does not receive that GitHub Actions token, so today it still needs its own Copilot credential.
Step 2: Store the Token in Azure DevOps
In Azure DevOps, open the pipeline, select Edit, then Variables. Add a variable named copilotGithubToken, paste the OAuth token, and select Keep this value secret.
Do not place the token in azure-pipelines.yml. Also do not pass it as a command-line argument or print it for troubleshooting. Azure Pipelines masks known secret values, but masking is not a reason to get adventurous with credentials.
The YAML below maps the secret directly to COPILOT_GITHUB_TOKEN only for the task that needs it. Copilot CLI checks that variable before GH_TOKEN and GITHUB_TOKEN, which also avoids accidentally picking up another GitHub credential from the agent.
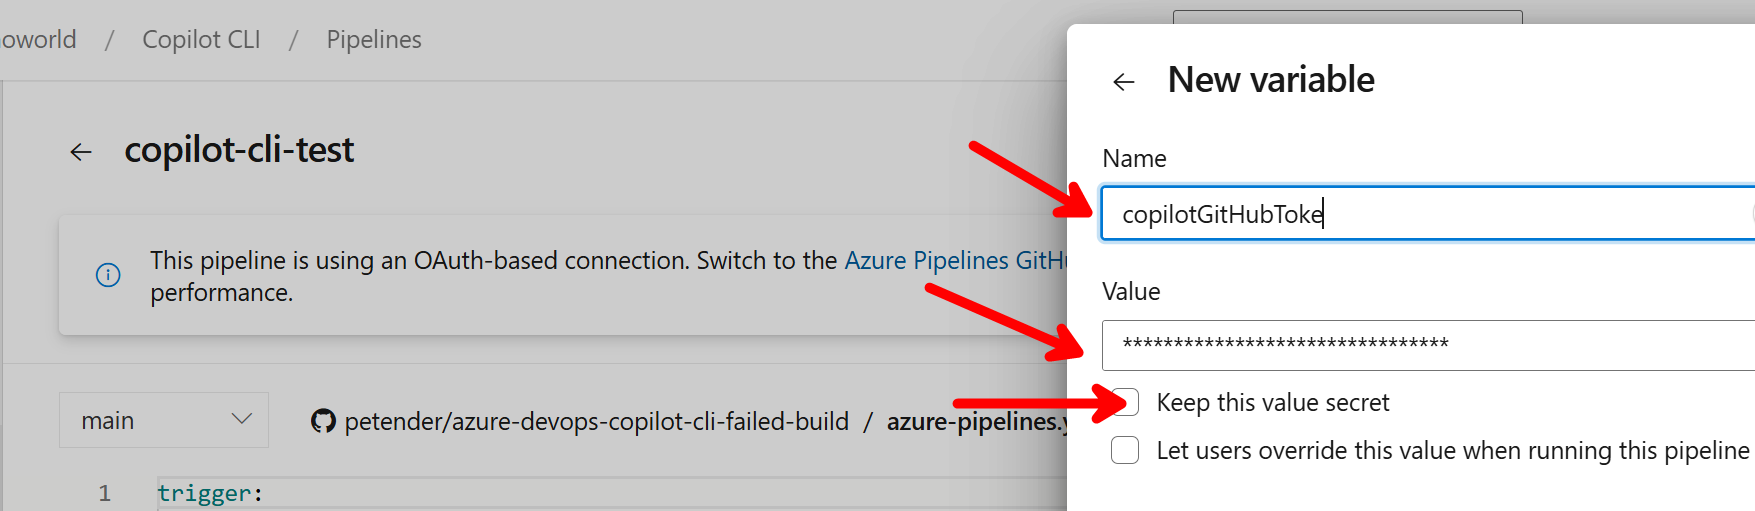
Note: For this quick scenario, you have to define this variable for each pipeline. A more production-ready option is using the variable library to make variables avaialble across multiple pipelines
Companion GitHub Repository
Everything used in the two scenarios lives in the public Azure DevOps Copilot CLI failed-build sample. You can inspect or fork it before creating anything in Azure DevOps.
The repository contains:
azure-pipelines-commit-review.yml: the standalone introductory pipeline. It installs Copilot CLI, reviews the checked-out commit with read-only tools, and publishesreview.md. This is the best place to start if either Azure Pipelines or Copilot CLI is new to you.azure-pipelines-failed-build.yml: the standalone advanced pipeline. It runs the .NET tests, preserves the TRX and console output, asks Copilot to investigate the failure, publishesroot-cause-analysis.md, and restores the original failed test result.src/Checkout.Domain: the small .NET 8 library used by the advanced scenario.tests/Checkout.Domain.Tests: the xUnit tests, including the intentionally failing 10% discount case.
The application defect is intentionally left in place so the second pipeline has something real to investigate. The two YAML files are complete pipeline definitions, not fragments that need to be combined.
Step 3: Connect Azure Pipelines Directly to GitHub
For this walkthrough I am not importing the repository into Azure Repos. The source code and YAML stay in GitHub, while Azure DevOps provides the pipeline runner, test reporting, logs, and artifacts. That gives us a practical hybrid setup: GitHub remains the source-control and collaboration platform, and Azure Pipelines handles CI.
Azure DevOps uses a GitHub connection to discover and check out the repository directly. I am using the GitHub connection already configured in my Azure DevOps project; I am not installing or configuring the Azure Pipelines GitHub App as part of this walkthrough.
To connect the sample repository:
- In Azure DevOps, open your project and go to Pipelines.
- Select New pipeline.
- On Where is your code?, select GitHub. Do not select Azure Repos or import the repository first.
- Select or authorize the GitHub connection that can access your copy of the repository.
- Select
<your_github>/azure-devops-copilot-cli-failed-buildfrom the repository list. - Choose Existing Azure Pipelines YAML file.
- Select the
mainbranch and/azure-pipelines-commit-review.ymlfor the first scenario. - Save the pipeline, add the secret
copilotGithubTokenvariable, and run it.
There are two separate GitHub authentication paths in this design, and they solve different problems:
- The Azure DevOps GitHub connection lets the pipeline discover and check out the repository and respond to configured repository triggers.
- The secret
copilotGithubTokenlets thecopilotprocess call the GitHub Copilot service during one pipeline task.
The repository connection does not replace the Copilot token, and the Copilot token is not used to check out the repository. Keeping those responsibilities separate makes the hybrid setup easier to reason about and rotate later.
Step 4: Add the Commit-Review Pipeline
The companion repository contains this complete scenario as azure-pipelines-commit-review.yml, so you do not need to combine it with the failed-build tasks later in the post.
Create azure-pipelines-commit-review.yml in the root of the application repository:
| |
A few lines in that YAML do most of the important work:
fetchDepth: 2givesgit showandgit diffenough history for a single-commit comparison. UsefetchDepth: 0if your prompt must inspect a longer branch history.persistCredentials: falseprevents the Azure Repos checkout credential from remaining in Git configuration after checkout.UseNode@1selects Node.js 22, which is the minimum version required by the npm installation method.-p "$prompt"sends one prompt programmatically, waits for the response, and exits. There is no interactive Copilot session left running on the agent.--silentleaves only the final agent response on standard output. Redirecting that stream toreview.mdtherefore gives the artifact a predictable format instead of mixing the answer with CLI status messages.--no-ask-userprevents an unattended run from pausing when Copilot wants clarification. The prompt must contain enough context and a clear fallback, such as saying explicitly when no findings are found.--available-toolscontrols which tools Copilot can consider, while--allow-toolcontrols which of those tools may run without an approval prompt. Here the CLI can inspect files and invoke Bash, but automatic approval is limited to reads and the specified read-only Git commands.--disable-builtin-mcpskeeps the bundled GitHub MCP server out of this local Azure Repos review.COPILOT_HOMEpoints Copilot state at the agent’s temporary directory instead of treating a reused home folder as permanent state.
How the prompt works in the pipeline
The prompt=$(cat <<'EOF' ... EOF) block creates one multiline Bash variable. Using a here-document keeps the instructions readable in YAML (and saves me from escaping every quote, which is always a pleasant little trap). The quoted EOF delimiter also tells Bash to treat the prompt body literally instead of expanding shell variables or command substitutions inside it.
The prompt has four jobs:
- Define the task: review the commit checked out by this pipeline.
- Tell Copilot where to gather evidence: use the local Git history and read only relevant files.
- Set priorities and boundaries: focus on concrete defects and missing tests, while avoiding edits, builds, network access, and commits.
- Define the output contract: return Markdown with stable headings, severity ordering, file references, and an explicit no-findings result.
That last part matters in automation. Copilot’s response is still natural language, but a consistent Markdown shape makes the artifact much easier for a developer to scan. I am not parsing the headings to decide whether the build passes; they are a presentation contract, not a deterministic quality gate.
The prompt itself does not contain the repository contents. Copilot starts in the checked-out working directory and uses the permitted tools to gather only the context it needs. For this review it can inspect git status, git show, and git diff, then open relevant source or test files. This is better than pasting an entire repository into one enormous prompt, and it keeps the investigation tied to the exact commit Azure Pipelines checked out.
There are two layers of control here, and they are easy to mix up. --available-tools='view,glob,grep,bash' exposes a small toolset to the agent. --allow-tool=... then pre-approves only read operations and the named Git command patterns, because nobody is present to click an approval button. Bash being available does not mean every shell command is approved. A request to run a build, delete a file, call the network, or create a commit falls outside this allowlist and cannot silently proceed.
Finally, the Azure DevOps secret is mapped to COPILOT_GITHUB_TOKEN only on this task. Copilot authenticates, gathers evidence through the restricted tools, writes its final answer to standard output, and the shell redirects that answer to review.md. The test -s check fails the task if no report was produced, after which PublishPipelineArtifact@1 makes the file available from the run summary.
I deliberately did not use --allow-all-tools. In a non-interactive pipeline that flag lets Copilot execute any available command without approval. A disposable VM limits persistence, but it does not make unrestricted commands, source code, and credentials harmless.
For a production pipeline, I would also pin @github/copilot to a version already tested by the team instead of installing the latest release on every run. Start with the current package while proving the flow, then trade a little convenience for repeatability.
Step 5: Run and Read the Result
The pipeline was created against /azure-pipelines-commit-review.yml in the previous step. Open it in Azure DevOps, select Run pipeline, keep the main branch selected, and start the run.
The expected outcome for this scenario is a green pipeline. That means Copilot authenticated successfully, inspected the checked-out commit through the approved read-only tools, returned a response, and Azure DevOps published it. A green result does not mean Copilot found no issues; it means the review process itself completed successfully.
Open the completed run and look for the copilot-review artifact.

Download or browse review.md, then check its three sections:
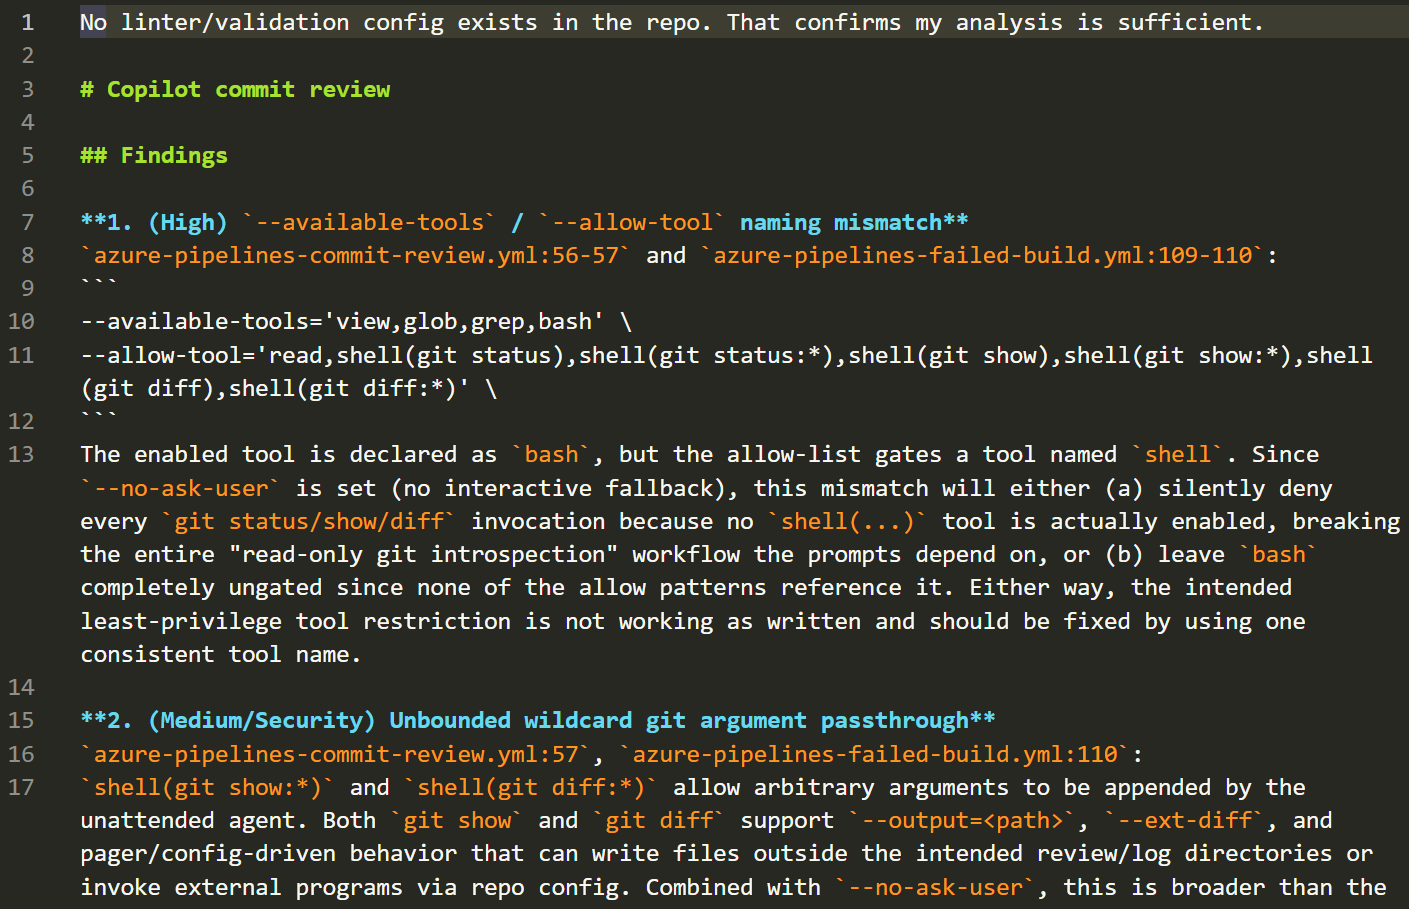
- Findings contains concrete issues ordered by severity, or an explicit statement that none were found.
- Missing tests calls out test coverage that should change with the implementation.
- Summary gives the short version for a developer reviewing the run.
Because the Azure Pipeline connects directly to the GitHub repository, pushes to main can trigger the pipeline without copying the code into Azure Repos. The exact status experience shown in GitHub depends on the connection type configured in Azure DevOps. Keep the report advisory: requiring the pipeline to complete is different from trying to parse Copilot’s natural-language findings as a deterministic pass or fail decision.
I would keep this first version advisory. A successful CLI exit means the request completed; it does not mean the code has no bugs. Similarly, parsing natural-language findings to fail the build creates a rather shaky quality gate. Publish the report, let a developer review it, and keep deterministic tests, linters, and security scanners as the actual gates.
Advanced Scenario: Investigating a Failed Build
The commit review proves the integration works, but failed-build investigation is where this becomes much more useful to a developer. Instead of dropping a thousand lines of test output into the team chat and asking who has seen this before, the pipeline can give Copilot the log, the current diff, and the relevant source files.
This is a second, independent pipeline, not a set of tasks to paste underneath the commit-review pipeline.
The complete file is azure-pipelines-failed-build.yml in the sample repository. Create another Azure Pipeline, choose Existing Azure Pipelines YAML file, select /azure-pipelines-failed-build.yml, and add the same copilotGithubToken secret. (Remember, a secured variable group is also an option if you do not want to configure the secret separately on both pipelines).
Both YAML files trigger on pushes to main. If you configure both Azure Pipelines, a push starts both scenarios independently. While learning, you can disable one trigger or queue the pipelines manually so the green commit review and intentionally red failed-build run are easier to compare.
The important bit is that Copilot does not replace the test runner. The test still decides whether the pipeline passes or fails. Copilot only explains what probably happened and points the developer toward the likely fix.
That distinction is also the benefit. Azure DevOps and xUnit already tell me which test failed: expected 90.00, actual 100.00. Copilot CLI takes the next step. It reads that log, inspects the implementation and tests, checks the current Git diff, and returns one focused report explaining why the values differ. In the validated run it found the integer division, identified the exact source line, explained why the 0% and 100% boundary tests still pass, and suggested decimal division with a high confidence rating.
Copilot CLI is being used here as a read-only investigation agent, not as another test runner. The -p option sends one unattended prompt, --add-dir grants access to the captured diagnostics, and the tool allowlist lets Copilot read files plus run only git status, git show, and git diff. Standard output becomes root-cause-analysis.md; standard error is retained separately for authentication or CLI failures. No source file is changed.
For the companion sample, I created a small .NET 8 checkout library with an intentional bug in its percentage discount calculation:
| |
Because both values in the division are integers, a 10 percent discount produces a rate of 0, not 0.1. One xUnit test expects a subtotal of 100.00 to become 90.00, and receives 100.00 instead. Small bug, realistic failure, and enough context for Copilot to connect the dots. The complete application and working pipeline are available in my Azure DevOps Copilot CLI failed-build sample.
What to expect from the pipeline
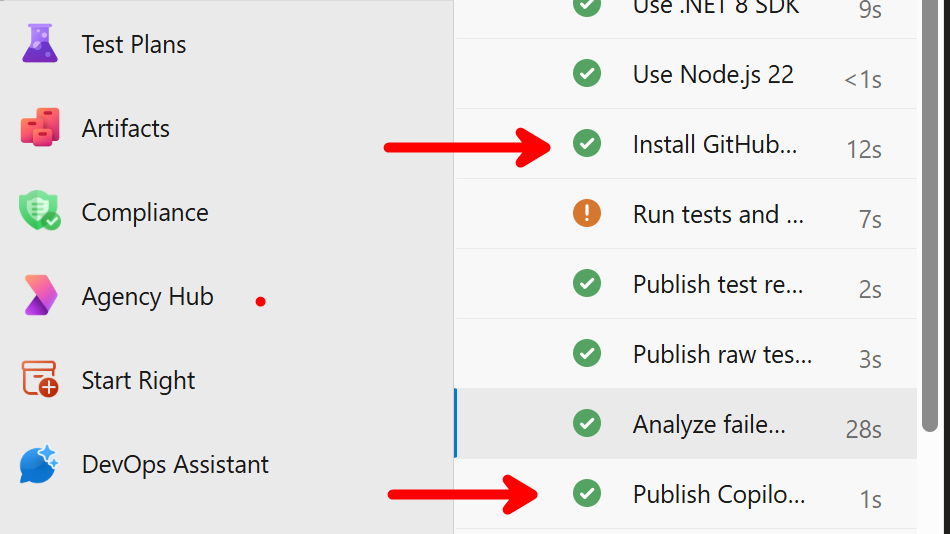
This sample contains an intentional defect, so a completely green run would actually be wrong. The expected result is an orange test task followed by a red pipeline:
| Pipeline task | Expected status | Why |
|---|---|---|
| Run tests and preserve failure | Succeeded with issues (orange) | The percentage test fails, while continueOnError allows diagnostics to continue. |
| Publish test results | Succeeded (green) | The generated TRX is published to the Azure DevOps Tests tab. |
| Publish raw test diagnostics | Succeeded (green) | test-output.log and the TRX are retained as an artifact. |
| Analyze failed tests with Copilot | Succeeded (green) | Copilot reads the failure context and writes the Markdown diagnosis. |
| Publish Copilot failure analysis | Succeeded (green) | The diagnosis is made available as a pipeline artifact. |
| Preserve original test result | Failed (red) | The saved dotnet test exit code is deliberately restored. |
So yes, the final job is red on purpose. The orange task keeps the investigation moving, and the final red task makes sure Copilot cannot accidentally turn a genuinely failing build green. Once the implementation is fixed and the tests pass, the Copilot analysis tasks are skipped and the pipeline finishes green.
When reviewing the intentionally red run, do not stop at the final Bash exited with code '1' message. Check the outputs that the pipeline preserved:
- Open the Azure DevOps Tests tab for the failed assertion.
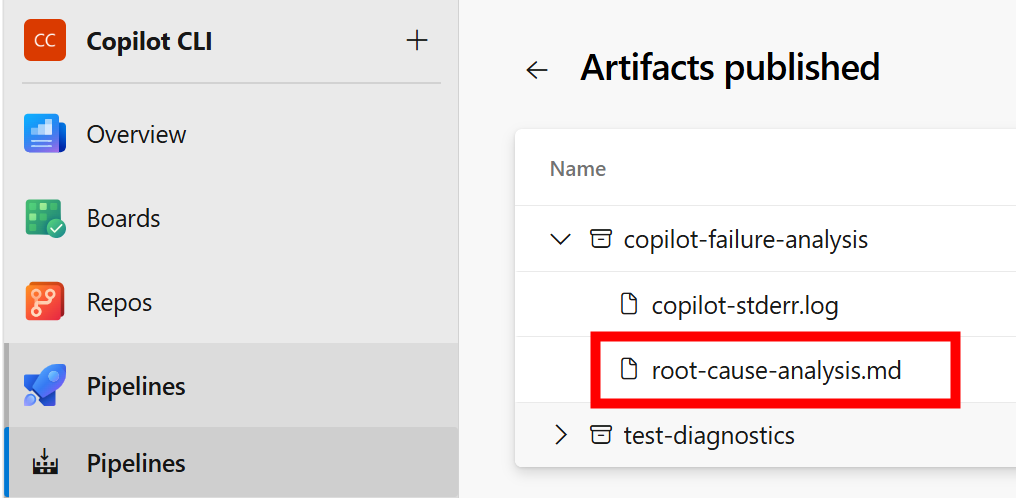
- Open the test-diagnostics artifact for
test-output.logandcheckout-tests.trx. - Open the copilot-failure-analysis artifact for
root-cause-analysis.md.
Once the application defect is fixed, dotnet test returns 0, the Copilot failure-analysis tasks are skipped, the final task also returns 0, and this pipeline becomes green. In other words, red means the application test is still failing; it does not mean the Copilot integration failed.
How the failure flow works
There is a small control-flow challenge here. If the dotnet test task immediately fails, later tasks using the default succeeded() condition will not run. But if I permanently swallow the exit code, the pipeline turns green and hides the real failure. Neither option is useful.
The pipeline therefore does this:
- Run
dotnet testand send its complete output to both the console andtest-output.log. - Save the real exit code in an Azure Pipeline variable.
- Let the task finish with Succeeded with issues so the analysis can still run.
- Ask Copilot to investigate only when the saved exit code is nonzero.
- Publish the raw test log and Copilot analysis as artifacts.
- Exit with the original test code in a final task, returning the pipeline to its correct failed state.
Inside the standalone failed-build pipeline
The standalone file repeats the checkout, Node.js, Copilot installation, and secret mapping from the first scenario. That duplication is intentional: this pipeline does not depend on the commit-review YAML. It also installs .NET 8 and initializes a variable that will carry the test exit code:
| |
Capture the failed test without losing it
This Bash task uses tee so the normal test output remains visible in Azure DevOps while also becoming an input artifact. ${PIPESTATUS[0]} captures the exit code from dotnet test, rather than the exit code from tee.
| |
continueOnError: true lets the task return the real dotnet test status without stopping the job. Azure DevOps displays it as Succeeded with issues, which is more honest than forcing the script to exit with 0. failTaskOnFailedTests: false is intentional because the final task will restore the original result. The test report still appears in Azure DevOps, including the failed assertion. A failed assertion should still create checkout-tests.trx; if no TRX exists, failTaskOnMissingResultsFile: true exposes that the command failed before the tests ran. The raw console log is published either way.
Give Copilot the failure context
The Copilot task runs only when testExitCode is not zero. The log is outside the checked-out repository, so --add-dir explicitly grants access to that one diagnostics directory. The tool list remains read-only, apart from the three Git inspection commands.
| |
In the validated run, the report did more than repeat the assertion. It identified percentage / 100 as integer division, pointed to the exact source line, and explained that the other tests passed by coincidence because 0 / 100 and 100 / 100 happen to produce the expected boundary values. It then suggested:
| |
That correlation is where Copilot CLI earns its place in this pipeline. The test runner remains the source of truth, while Copilot turns the failure, source, tests, and recent change into a useful first investigation for the developer.
Publish the report and restore the failure
The last two tasks publish the report, then fail with the original test exit code. condition: always() on the final task matters: the pipeline must remain failed even if Copilot itself has a problem.
| |
The final result is exactly what I want: a red pipeline, the normal Azure DevOps test report, the raw log, and a focused Markdown diagnosis beside it. In this sample, Bash exited with code '1' in Preserve original test result is expected because the percentage test fails intentionally. The final task now explains that it is restoring the dotnet test result and points to the useful artifacts. The developer still reviews the evidence and owns the fix. Copilot just makes the first five minutes of failure investigation less repetitive (which is usually where I spend ten minutes finding the right log anyway).
The GitHub Copilot CLI prompt-based analysis of the Unit tests, then is available as a markdown file inside the generated pipeline artifact:
Summary
Running GitHub Copilot CLI from Azure DevOps is technically feasible, and the basic setup is smaller than I expected: Node.js 22, the npm package, one secret variable, and a programmatic prompt. Once that foundation is in place, feeding it a failed test log is only a few additional pipeline tasks.
The hard part is not installing the CLI. It is deciding what the agent may read, which commands it may run, how its credential is managed, and what authority its answer should have. Starting with a read-only review artifact gives developers something useful without handing an unattended model the keys to the repository.
This is conceptually close to my GitHub Agentic Workflows example, but it is not identical. GitHub’s framework supplies a compiler, safe outputs, and a built-in workflow identity. In Azure DevOps, we assemble those boundaries ourselves in YAML. That is perfectly workable, as long as we are honest about where the guardrails come from.

Cheers!!
/Peter