When I was still on the Microsoft Technical Trainer, delivering classes or presenting to Executives or speaking at conferences on AI (M365 Copilot, Foundry and Github Copilot primarily), apart from the technical conversations, one other question that always popped up, was “great scenario Peter, but what does this actually cost?” And while GitHub Enterprise with GitHub Copilot provides great insights, not all developers use GitHub Copilot organization-wide.
That’s where about 4 months back, I compiled a basic GitHub Copilot Consumption Viewer terminal app together, sharing simple metrics on tokens, LLMs used, etc.
Now, several months later, and literally using GitHub Copilot for almost everything I do in my day-to-day job as Senior Content Developer, the question remains, even for my own curiousness. I am literally doing amazingly cool things with VS Code agents, and as Microsoft employee don’t really have to worry about cost.
But it doesn’t mean I can’t be cost conscious about the tools and platforms I’m using :).
Finding an answer to questions like “How many tokens am I burning through?”. “Which models get called for which tasks?”. “What’s this costing me in real terms versus what I’d pay if I called the APIs directly?”
The GitHub Copilot portal shows you some usage stats, but it’s pretty high-level. If you’re on an Enterprise seat (like I am), you see a monthly AI Unit allowance and how much you’ve consumed, but good luck figuring out which sessions or workflows are expensive. And if you’re trying to understand the value you’re getting - comparing what you pay GitHub versus what those same tokens would cost at list API prices - you’re out of luck entirely.
So I built something to fix that: a self-hosted telemetry dashboard using OpenTelemetry, Grafana, Prometheus, Tempo, and Loki. While this might look like a complex technology stack, don’t worry. Docker compose to the rescue…
It captures everything GitHub Copilot Chat emits from VS Code - traces, metrics, and event logs - stores those locally in a Docker stack, and surfaces three Grafana dashboards that answer the questions I actually care about. The whole thing runs on your local machine, costs nothing beyond what you already pay for Copilot, and doesn’t send any data to the cloud.
(Btw, you could build a similar scenario with Azure, Log Analytics and Application Insights, using the same OpenTelemetry - but that requires an Azure subscription, with more budget to run all this, which was not my goal for the time being… but maybe a good idea to make it larger-scale ready if anyone is interested…)
I published the workable source code on GitHub earlier this week: GitHubCopilotDashboard. Let me walk you through what it does and how to set it up.
What problem does this solve?
GitHub Copilot is a fantastic productivity multiplier, but it’s effectively a black box from an observability perspective. You chat with an agent, it calls tools, it invokes models, and… that’s it. No per-session cost breakdown, no model-level token visibility, no trace tree showing exactly which tools fired and why.
This becomes a real issue when you want to:
- Understand your actual GitHub bill. If you’re on a paid plan with an AI Unit allowance, how much of that allowance have you consumed this month? What happens if you go over? (Spoiler: depends on your plan or your GitHub Administrator - some cap you, some charge overage, some are unlimited.)
- Identify expensive workflows. Not all Copilot sessions are equal. A quick one-liner code suggestion costs almost nothing. A complex agent workflow that edits five files, runs terminal commands, and iterates with you for 10 minutes? That can burn through thousands (or millions as I found out in one example :-) ) of tokens. Which sessions are the heavy hitters?
- Compare model efficiency. Copilot routes requests to different models (Claude Sonnet, GPT-4o, etc.) depending on the task. If you could see token usage per model, you’d know which ones are more efficient for your workload.
- Quantify ROI. What would those same tokens cost if you called the model APIs directly? That delta is the value GitHub is providing by bundling models, tooling, and infrastructure into one seat price.
The dashboard answers all of these questions using data that Copilot already emits - you just need to capture it.
How it works (architecture)
GitHub Copilot Chat in VS Code supports OpenTelemetry export as of a recent update (you need the setting github.copilot.chat.otel.enabled - if you don’t see it, update Copilot Chat).
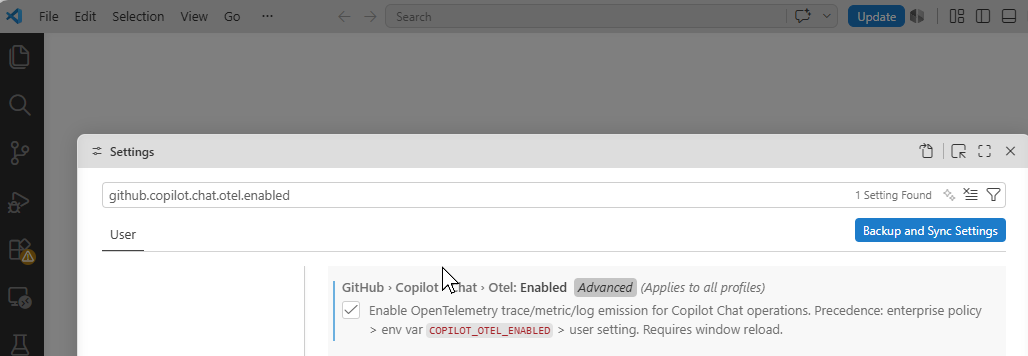
When enabled, it emits three signal types over OTLP:
- Traces (spans) - hierarchical call trees showing agent invocations, LLM calls, tool executions, and hooks
- Metrics - counters and histograms for token usage, operation duration, time-to-first-token, tool call counts, etc.
- Events/logs - structured event stream with session starts, feedback, edit accept/reject, and (optionally) prompt/response content
The dashboard stack uses an OpenTelemetry Collector to receive all three signals on one endpoint, then fans them out to purpose-built backends:
- Tempo stores traces (span trees, prompt content if enabled)
- Prometheus stores metrics (token counters, derived cost metrics)
- Loki stores events/logs (session events, structured logs)
- Grafana queries all three and renders the dashboards
The collector also does some clever processing in the middle - it extracts session names from the first user prompt (if content capture is enabled), derives per-session cost metrics, and calculates shadow API pricing for ROI analysis.
The whole thing runs in Docker Compose with five containers. No cloud dependencies, no external SaaS, all your data stays on your machine.
Setup (it’s easier than it sounds)
Prerequisites
You need:
- Docker Desktop (or Docker Engine + Compose v2)
- VS Code with a recent version of GitHub Copilot Chat (the OTel export setting must exist)
That’s it. No Azure subscription, no cloud accounts, no npm installs.
Step 1: Clone the repo and start the stack
| |
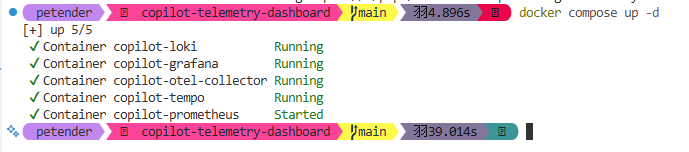
Within 30 seconds you should have five running containers: otel-collector, tempo, prometheus, loki, and grafana.
Step 2: Point VS Code at the collector
Open your User settings.json (Ctrl+Shift+P → Preferences: Open User Settings (JSON)) and add:
| |
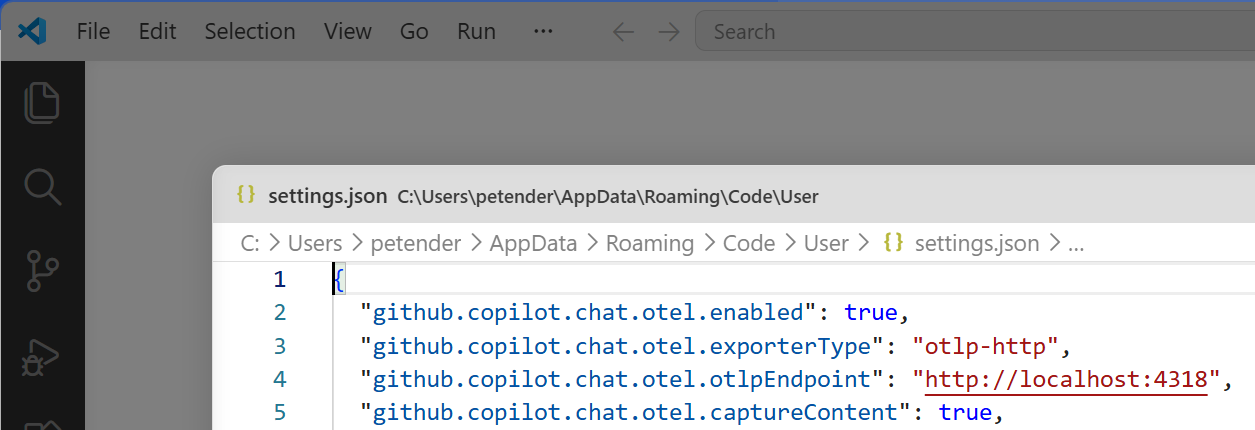
Important: Use User settings, not workspace settings. The OTel SDK initializes early in VS Code startup, and workspace settings can load too late.
The captureContent setting controls whether prompt/response text is captured. Set it to true for readable session names and full trace detail, or false for metadata-only (metrics still work, but session names fall back to UUIDs - which I think are less useful, as we don’t speak UUID language here).
Step 3: Reload VS Code
Ctrl+Shift+P → Developer: Reload Window. The OTel SDK only initializes at startup, so you need a full reload for the settings to take effect.
Step 4: Use Copilot, then open Grafana
Use Copilot Chat or agent mode as you normally would. Then open http://localhost:3000 in a browser. Default creds are admin / admin (you’ll be prompted to change it, but you can skip that for local use).
Navigate to Dashboards → GitHub Copilot folder. You’ll see three dashboards. Data appears within 30–60 seconds (Prometheus scrapes every 15 seconds, dashboards refresh every 10 seconds to 5 minutes depending on the panel).
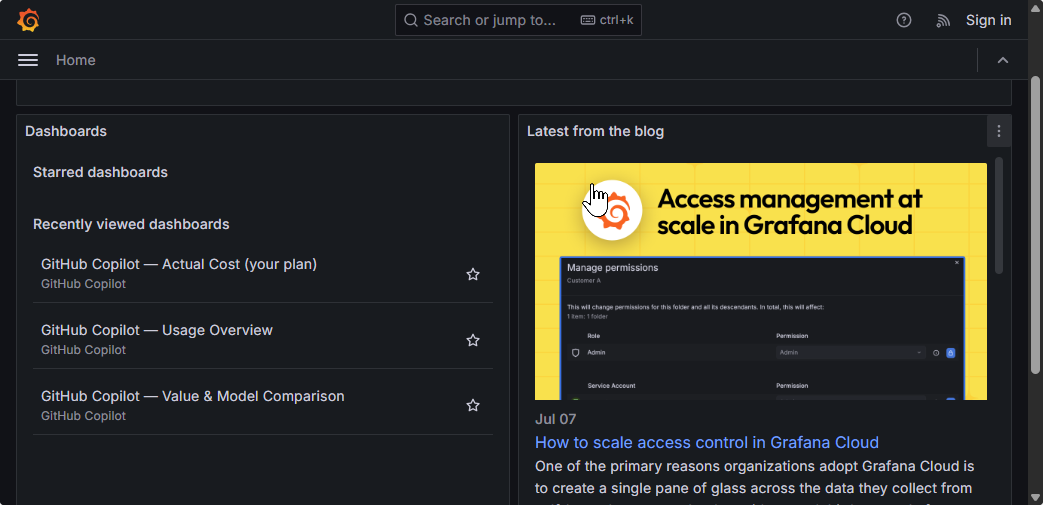
The three dashboards (what you actually get)
1. Actual Cost (your plan) - the main cost view
This is the dashboard I check every week. It’s plan-aware, meaning you pick your Copilot plan from a dropdown (Individual, Business, Enterprise), and it calculates what you’re actually paying GitHub this month.
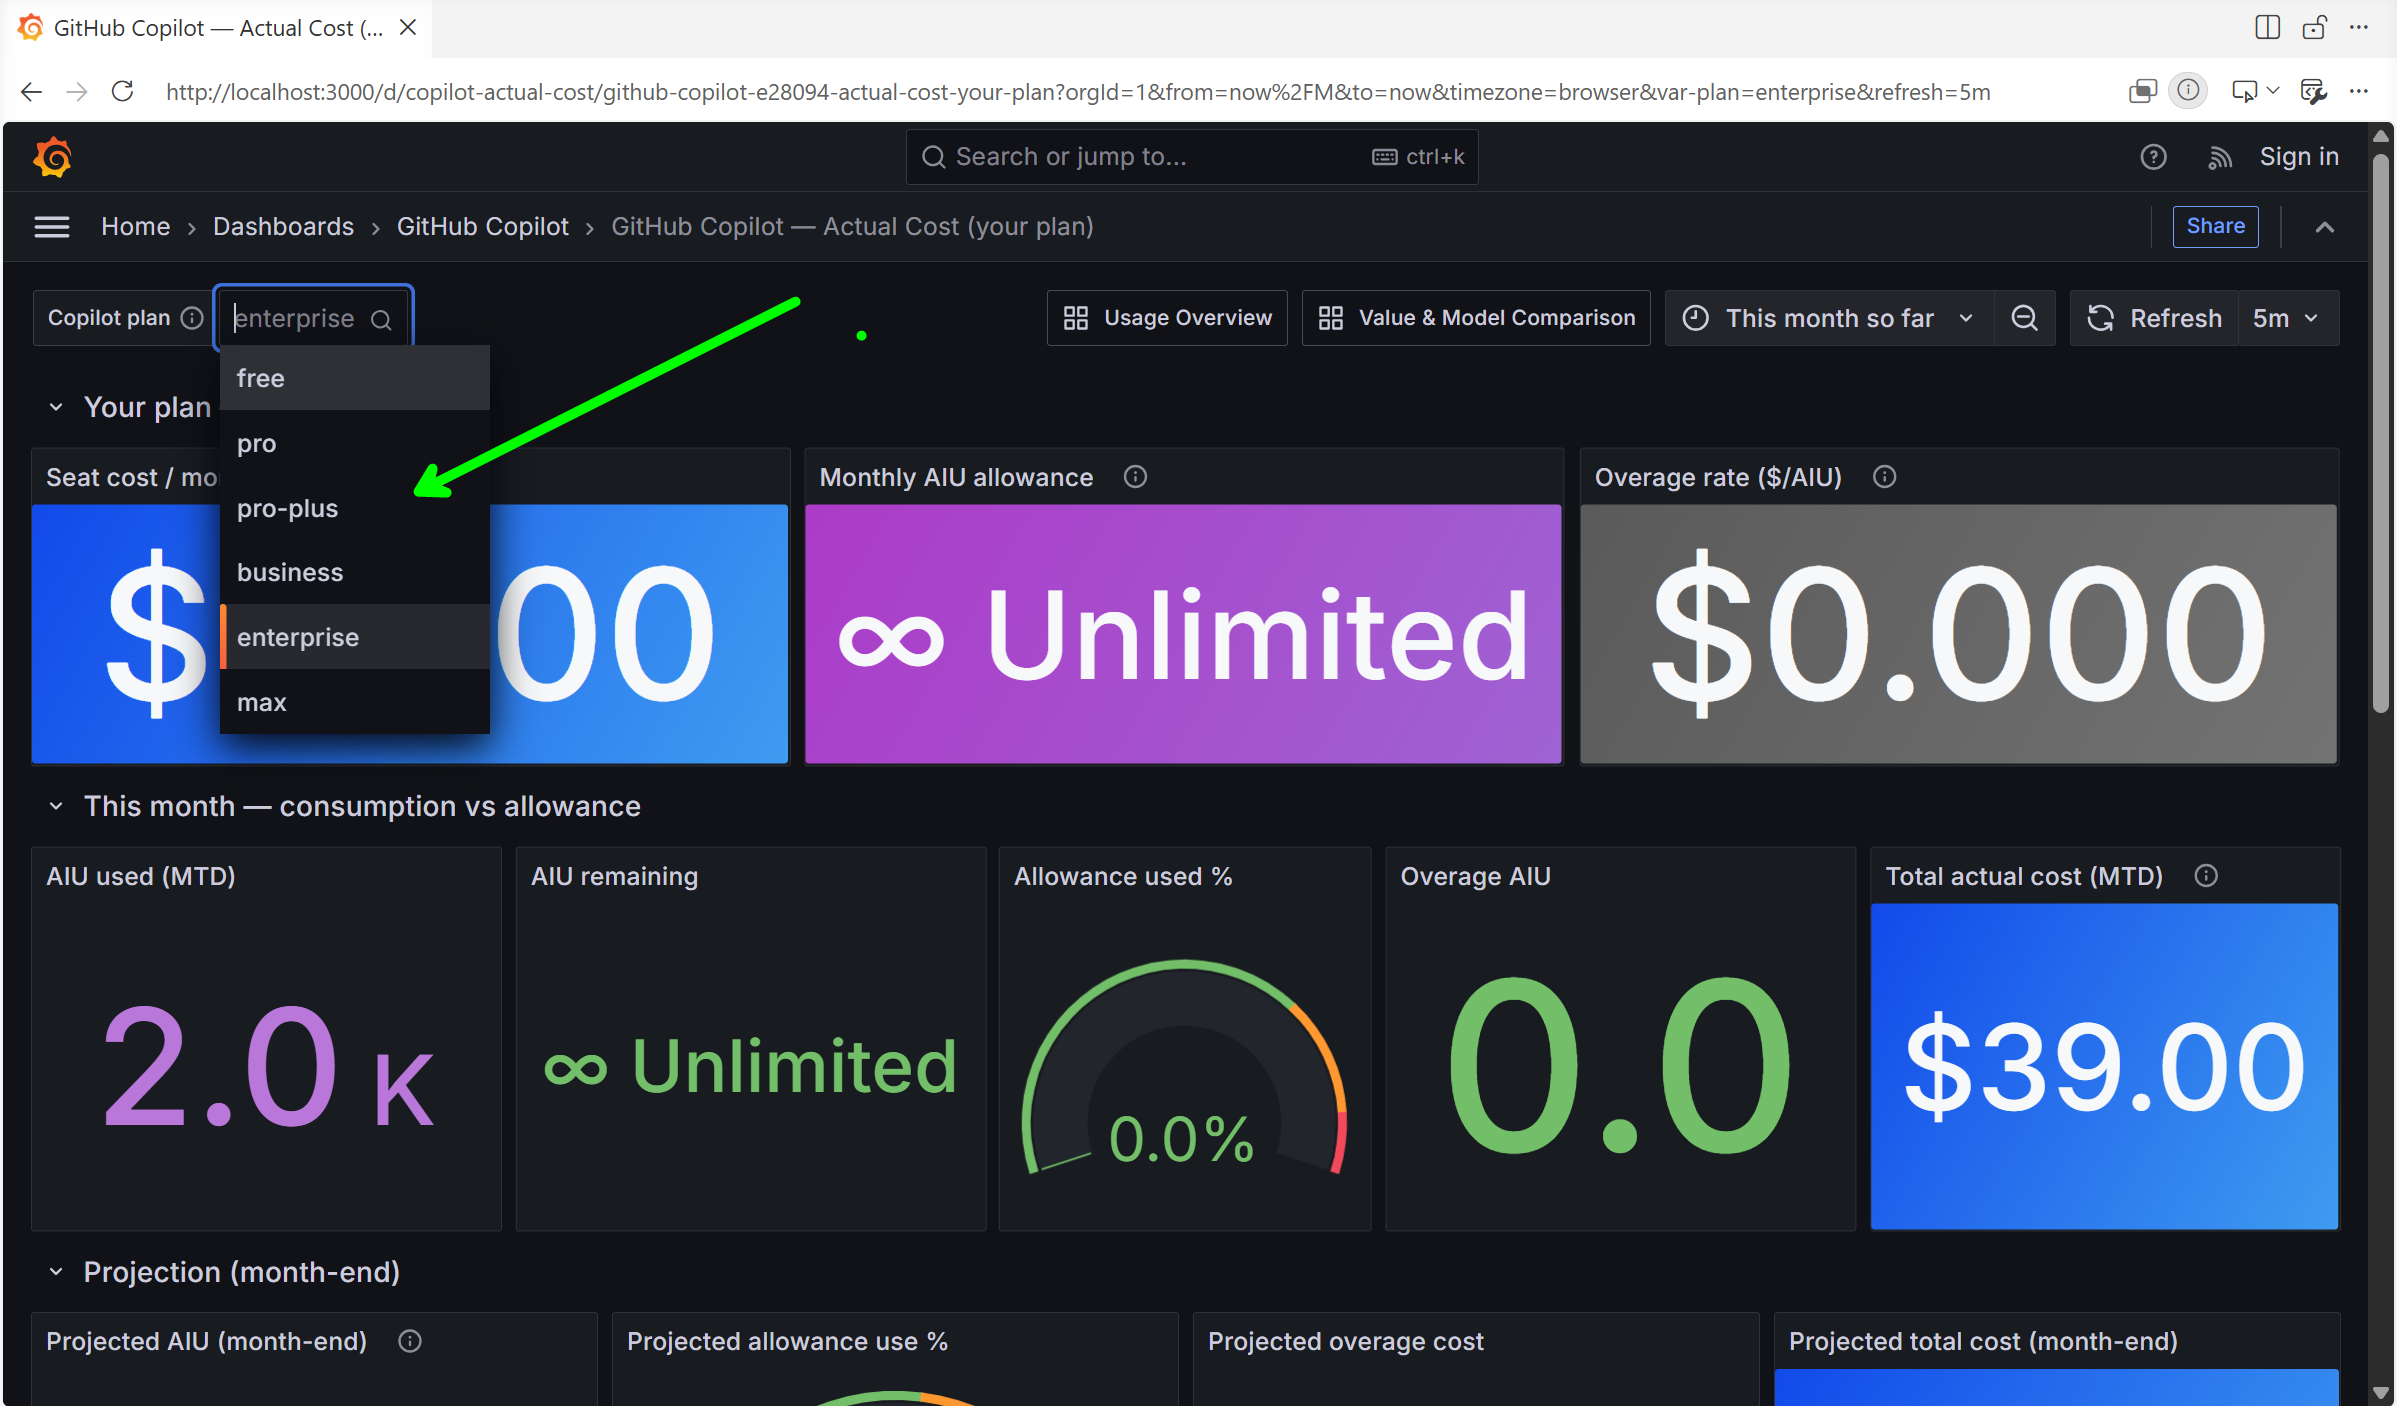
Key metrics:
- Seat cost / month - the fixed price you pay regardless of usage ($10, $19, $39, etc.)
- Monthly AI Unit allowance - included usage for your plan (shows ∞ Unlimited for Enterprise)
- AIU used / remaining / used % - consumption offset against your allowance
- Overage AIU / cost - consumption beyond the allowance × overage rate (zero for unlimited plans)
- Total actual cost (MTD) - seat cost + overage (for unlimited plans, this equals the seat price)
- Projection - straight-line month-end estimate based on current usage
- AI Units / tokens by model - breakdown of where consumption goes
- Cost by session - chat conversations ranked by AI Units (find the expensive tasks)
For me, this confirmed what I suspected: I’m on an Enterprise seat with unlimited usage, so my cost is flat at $39/month regardless of how much I use it. But if I were on Individual ($10/month with a limited allowance), I’d see exactly how close I am to hitting overage charges.
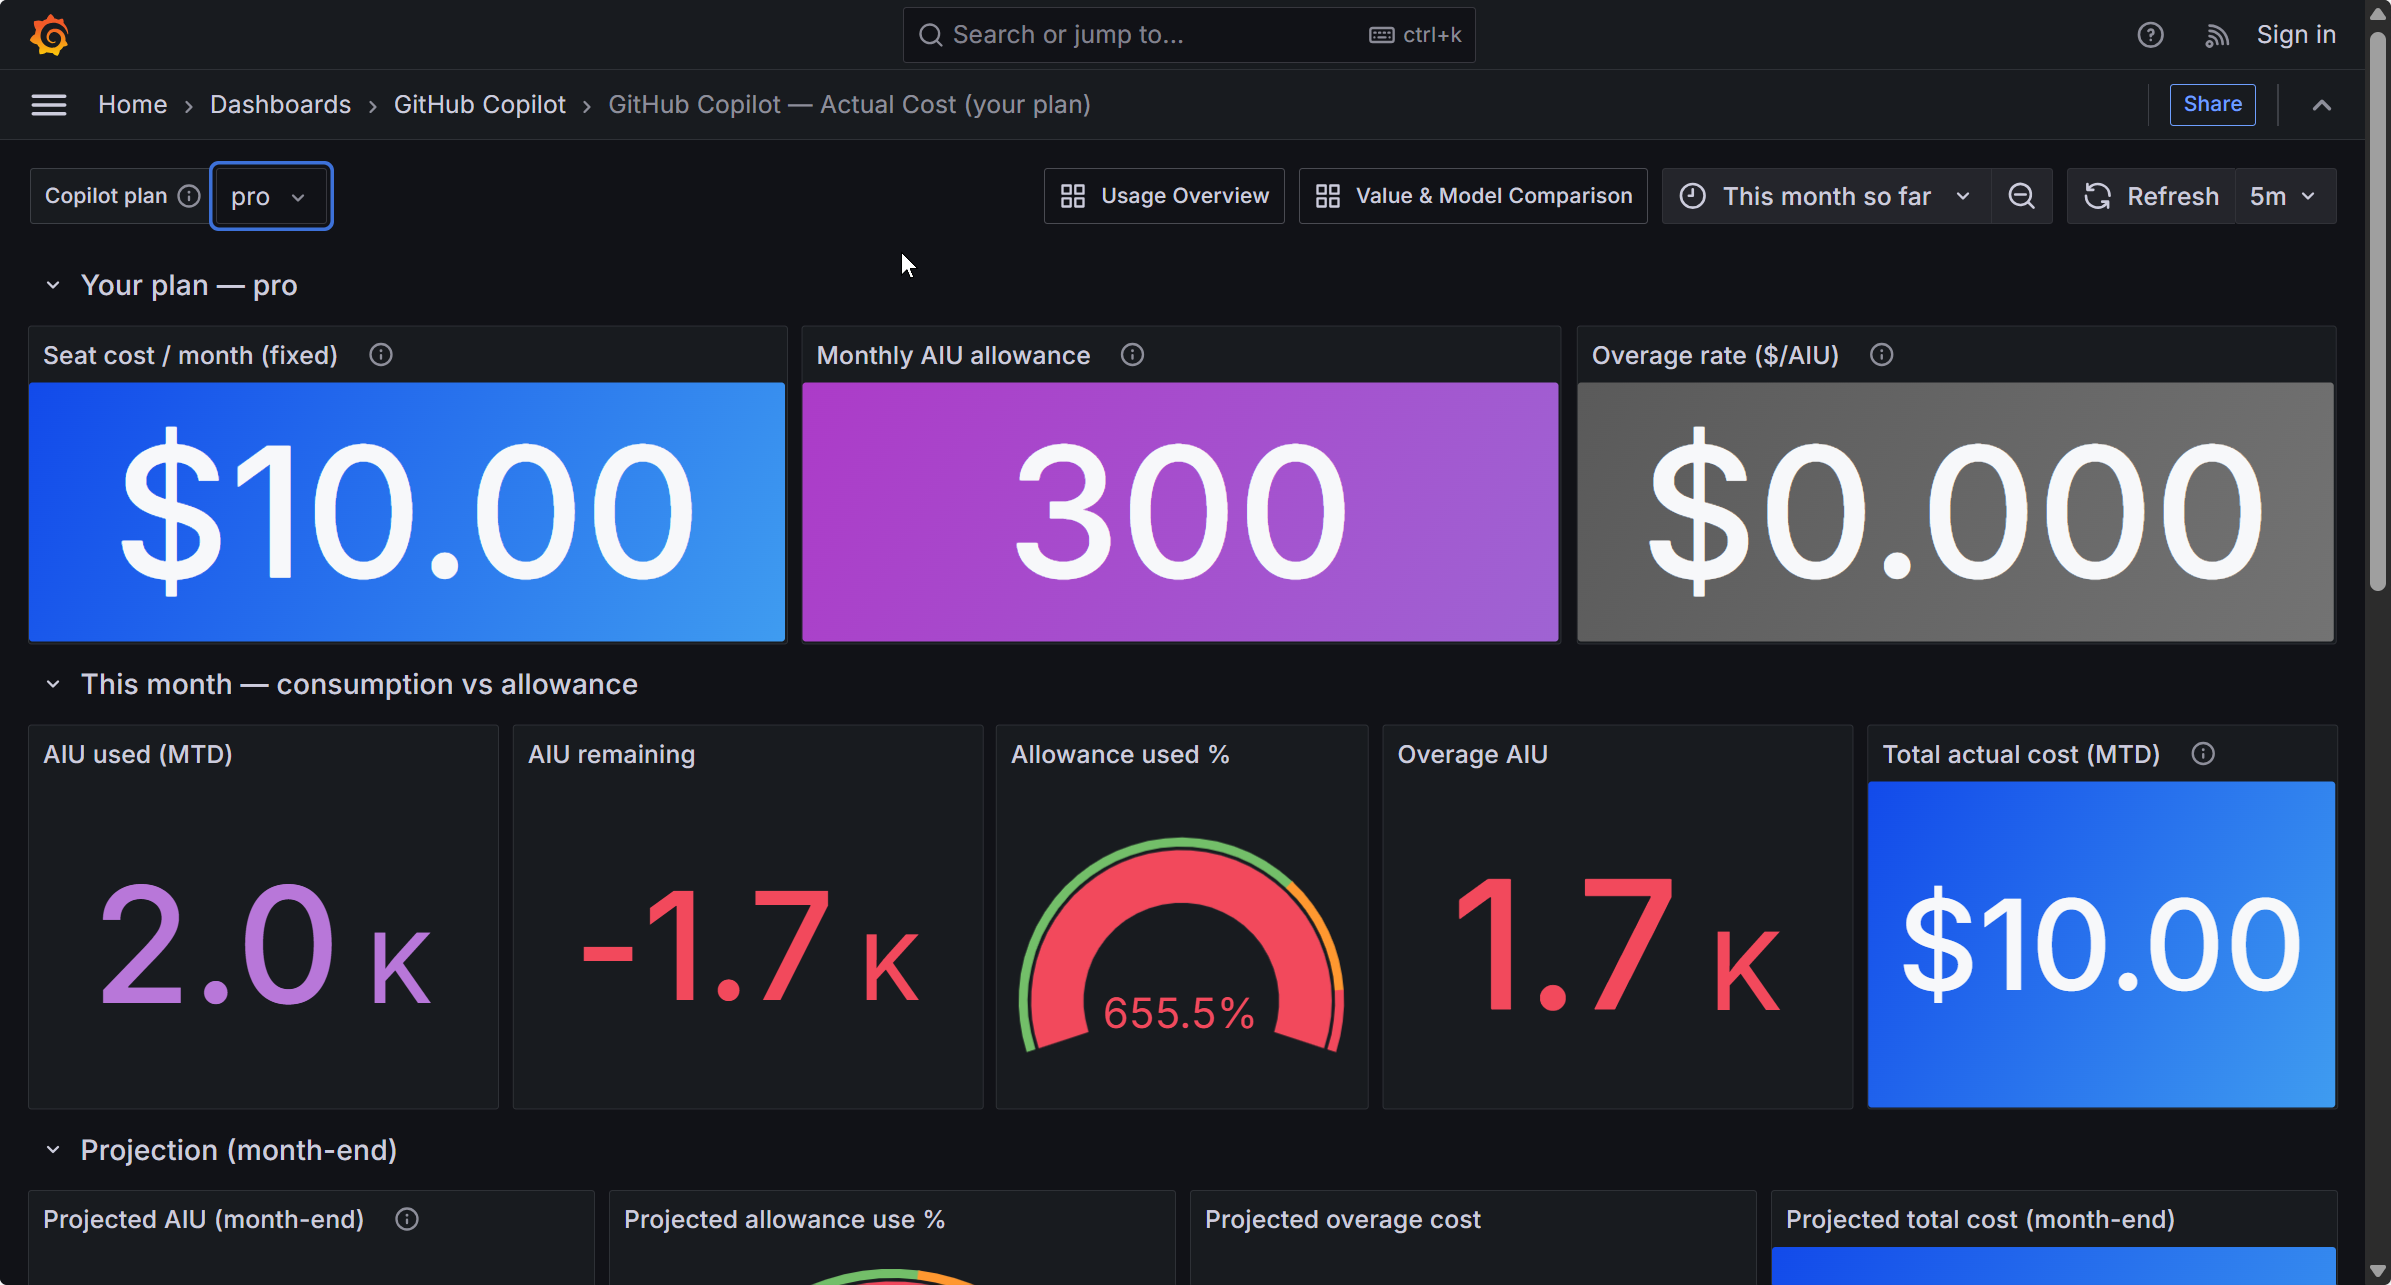
The plan config lives in config/prometheus-rules.yml - you edit the seat price, included AI Units, and overage rate per plan. After editing, reload Prometheus with docker compose kill -s SIGHUP prometheus.
2. Usage Overview - operational view + per-session analysis
This is the “what’s happening right now” dashboard. It’s not about cost - it’s about understanding your usage patterns.
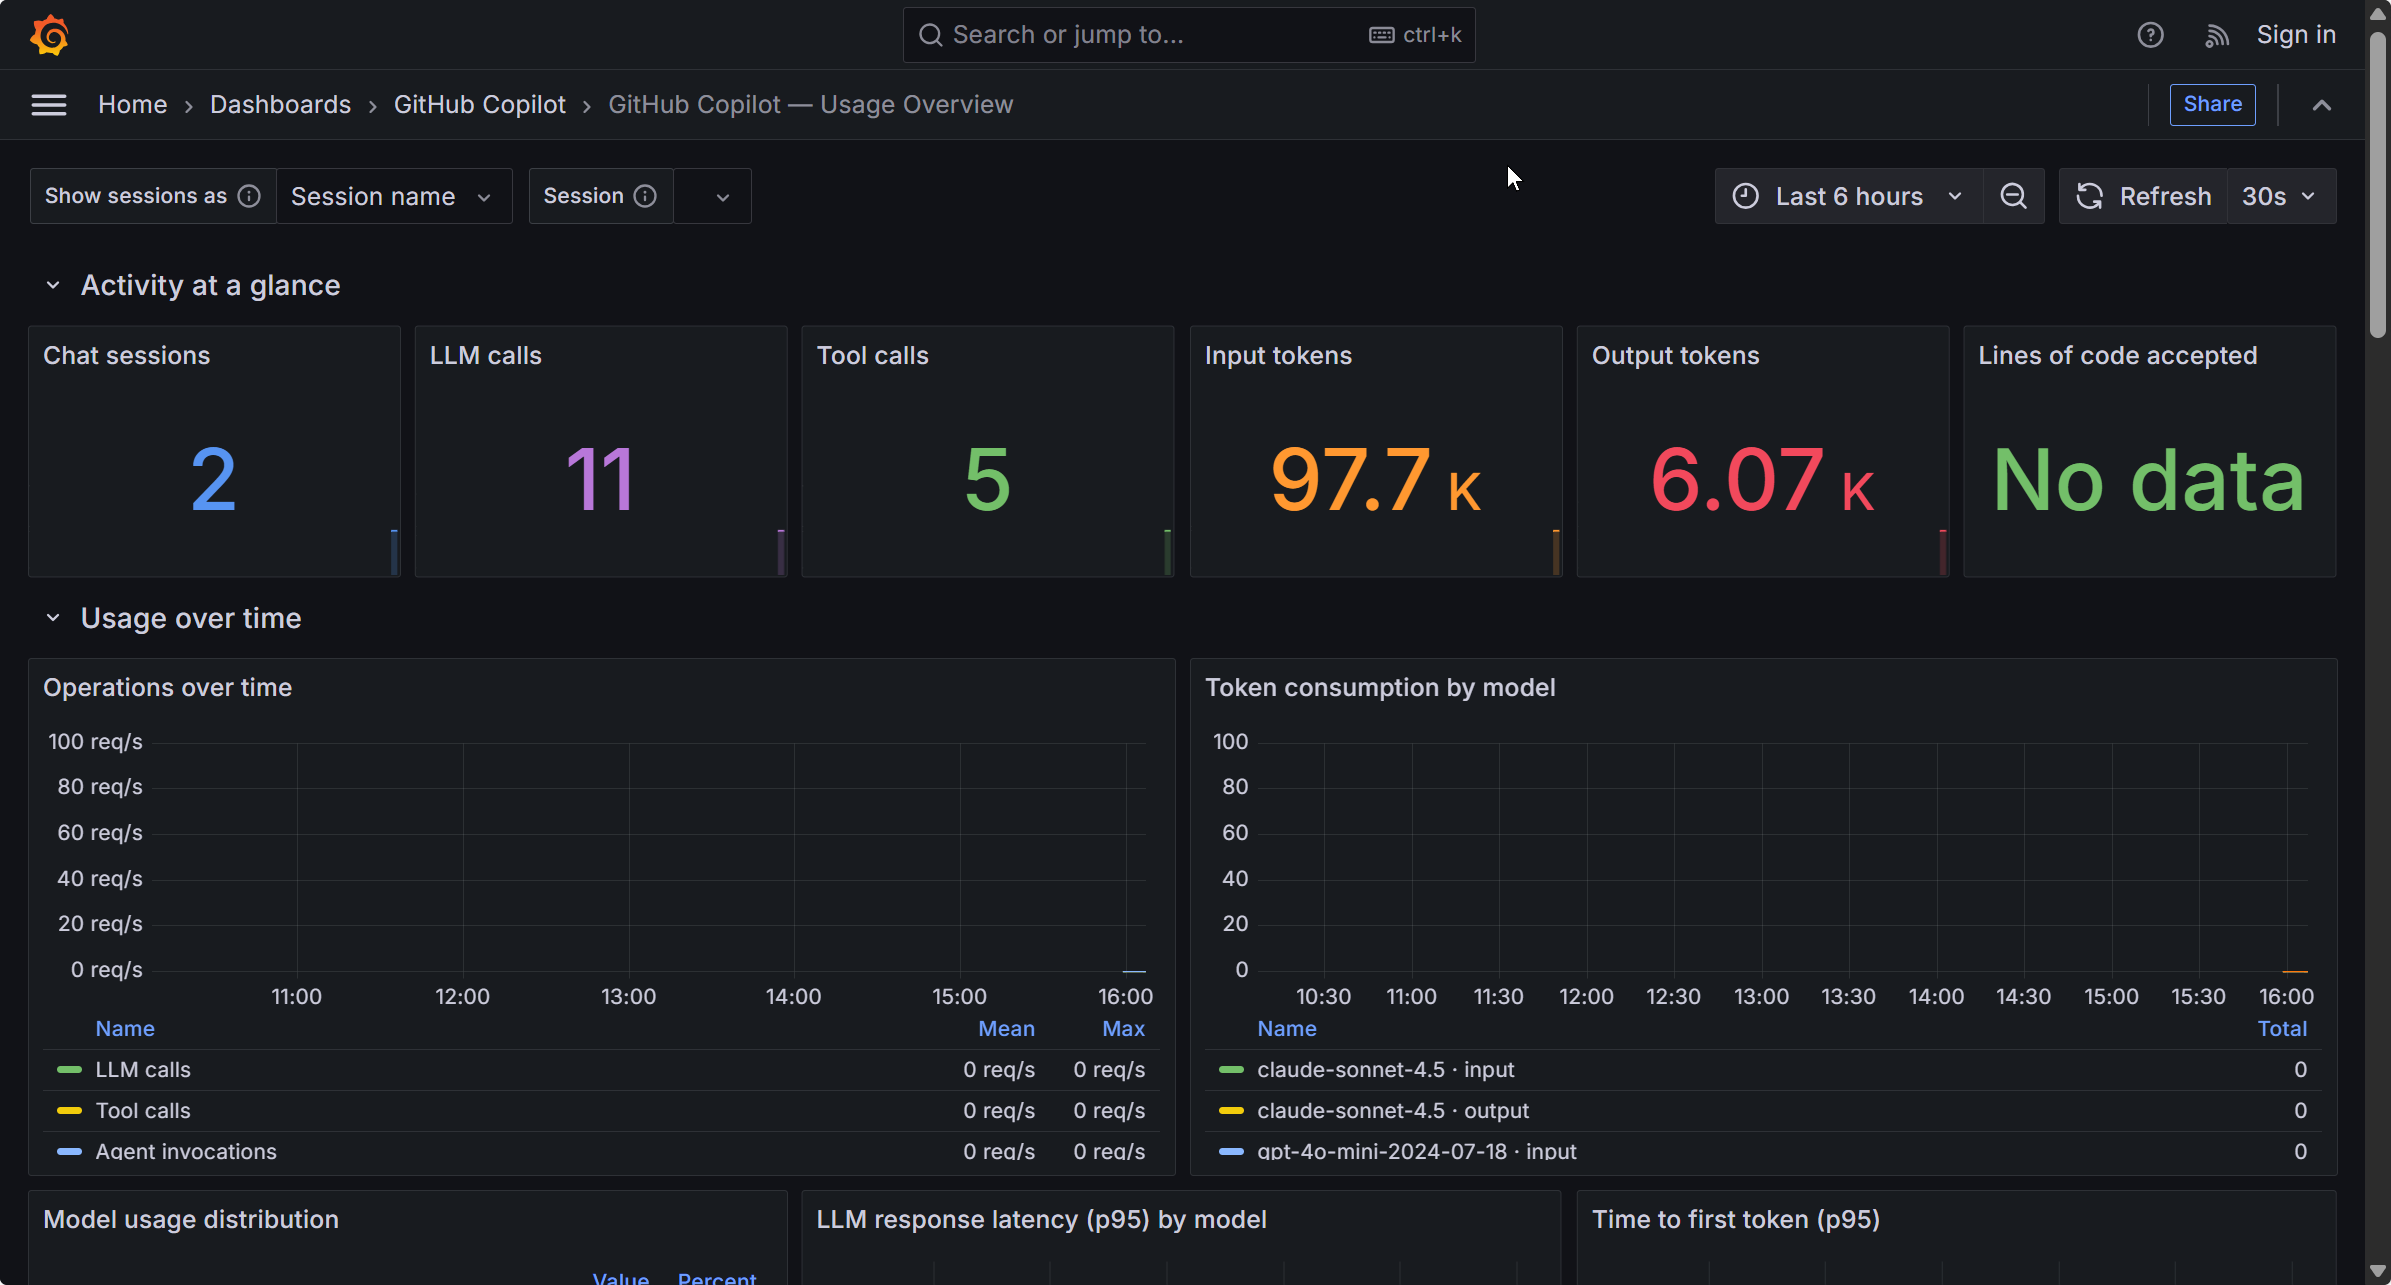
Key sections:
- Activity at a glance - sessions, LLM calls, tool calls, tokens, lines of code
- Usage over time - operations, token consumption by model, model distribution
- Latency - LLM response p95 by model, time-to-first-token p95
- Cache, tools & quality - prompt-cache hits vs creation, top tools, tool latency, errors, edit-acceptance activity
- Recent agent operations - a live trace table (click any span to drill into Tempo)
- Per-session breakdown:
- “Show sessions as” toggle - session name or conversation UUID
- Selected session stats (AIU / input / output) - driven by the Session dropdown
- Chat sessions table - every session ranked by AIU/tokens
- Session drill-down - Tempo traces for the selected session (expand to see exact tools and models used)
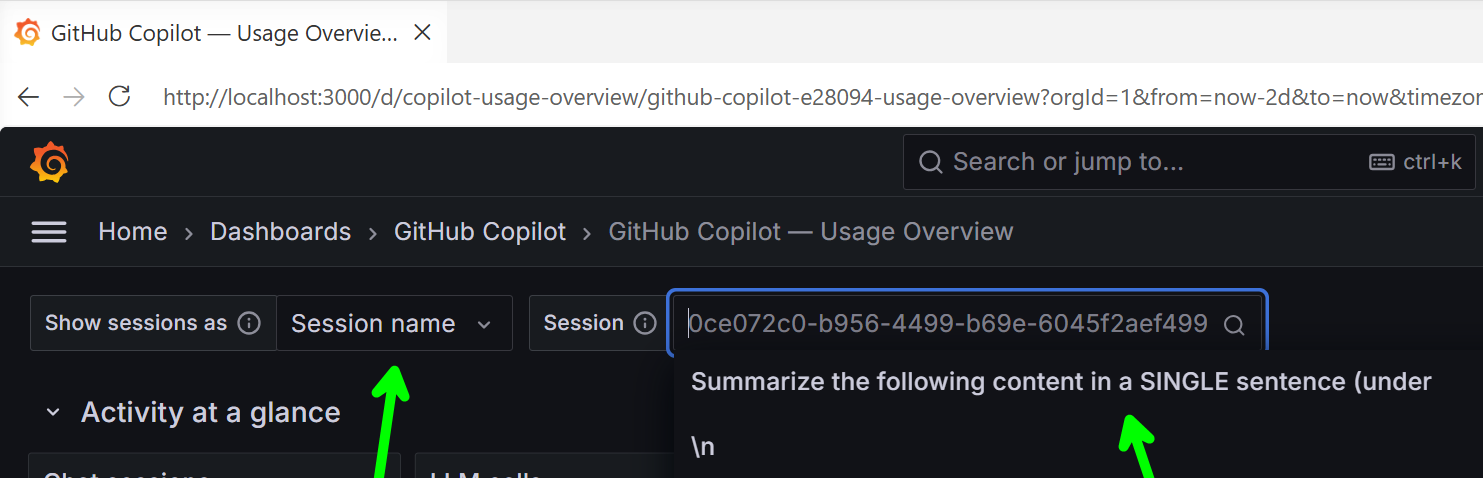
The session-name extraction is my favorite feature. The collector parses the first user prompt from gen_ai.input.messages and uses a short snippet as the copilot_session_name label. So instead of seeing f47ac10b-58cc-4372-a567-0e02b2c3d479, you see something like "summarize the following content...". Makes it way easier to identify which session is which.
3. Value & Model Comparison - shadow pricing (not your bill)
This dashboard answers the question: What would these tokens cost at raw model API list prices?
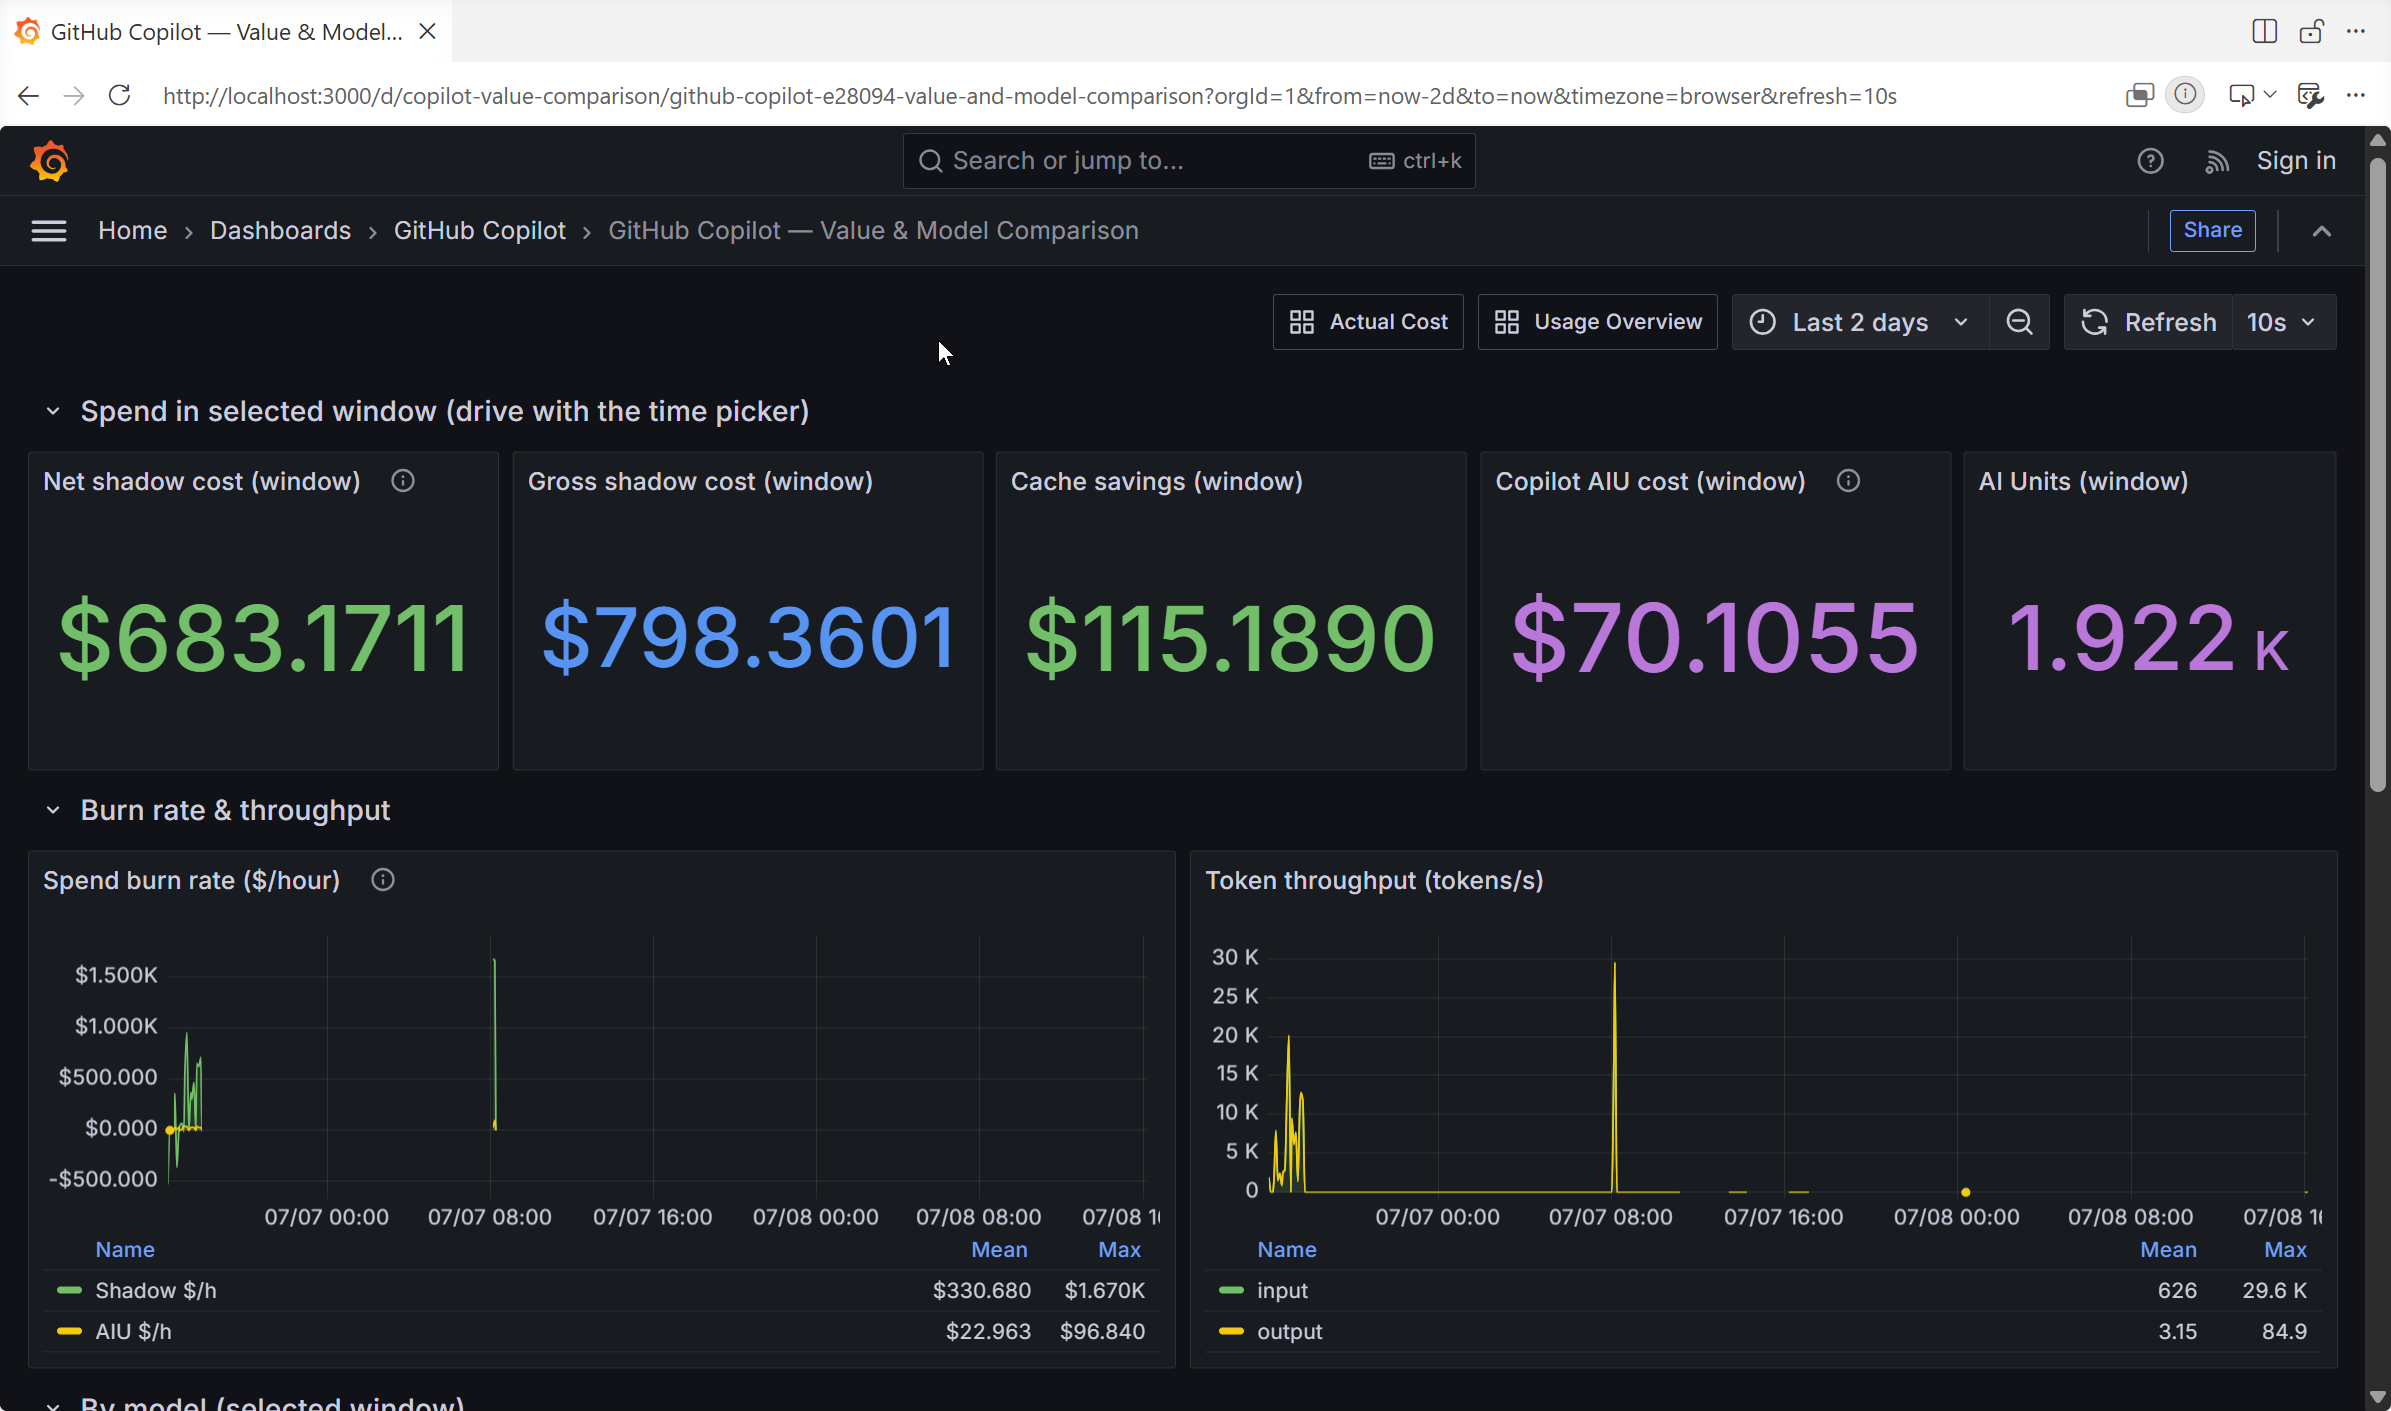
Key metrics:
- Gross shadow cost - sum of (input tokens × input price) + (output tokens × output price) for each model
- Prompt-cache savings - tokens served from cache × cache price delta (cache is cheaper than fresh input)
- Net shadow cost - gross cost minus cache savings
- Spend burn rate - how fast you’re “spending” in shadow-cost terms
- Per-model comparison - breakdown by model showing which ones dominate your usage
- Cache & reasoning token detail - visibility into o1-style reasoning tokens and cache efficiency
The config for model prices lives in config/prometheus-rules.yml - you set USD per 1M tokens (input/output/cached) for each model. The defaults are based on public API pricing as of June 2026, but you can calibrate them to match your preferred comparison baseline.
One gotcha: the net cost calculation is increase(gross) − increase(savings) because net cost isn’t monotonic (a heavily-cached call increases savings faster than gross), so applying increase() or rate() directly to net would be wrong. The Prometheus recording rules handle this for you.
Privacy and content capture (you choose)
The captureContent setting is the privacy control. When true, prompt and response text flows to Loki (structured event logs) and Tempo (span attributes). Short first-prompt snippets also become the copilot_session_name label in Prometheus.
When false, you get metadata-only - token counts, model names, tool calls, latencies, errors, etc., but no actual prompt/response content. Session names fall back to the conversation UUID.
Either way, nothing leaves your machine. The OTel collector only exports to local Docker containers. No cloud, no SaaS, no external telemetry backends. If you want to send data elsewhere (say, a corporate Grafana Cloud instance), you’d need to change the exporter config in config/otel-collector-config.yaml, but the default is local-only.
I run with captureContent: true because I want readable session names and the ability to drill into Tempo to see exactly what prompt triggered what tool. But if you’re working on sensitive code or customer data, flip it to false and you still get all the usage/cost metrics.
What I learned running this for a few days
A few observations after using this dashboard daily:
Agent mode is way more expensive than simple completions. A quick inline code suggestion might use 500 tokens. A multi-turn agent workflow that edits files, runs commands, and iterates with you? Easily 10,000–20,000 tokens per session. The “Cost by session” panel makes this painfully obvious.
Prompt caching is a big win. On sessions where I’m working in the same codebase repeatedly, cache-read tokens can be 50–70% of total input tokens. That’s a massive cost saving at list API prices (and probably why GitHub can offer unlimited Enterprise seats profitably).
Claude Sonnet dominates my usage. About 80% of my LLM calls route to
claude-sonnet-4.5. GPT-4o shows up occasionally for specific tasks, but Sonnet is clearly the workhorse. (I’m pretty sure just saying “yes” would have worked too, but the model distribution chart is fun to watch.)Time-to-first-token is impressively fast. P95 latency is under 2 seconds for most models, even with agent mode overhead. The LLM call itself is rarely the bottleneck - it’s usually tool execution (file reads, terminal commands) that adds wait time.
Some sessions are just… weird. I had one session that consumed 45,000 tokens and called 12 different tools. I have no idea what I asked it to do. (This is why the Tempo trace drill-down exists - you can expand the span tree and see the exact sequence of tool calls. Mystery solved: I asked it to refactor a multi-file .legacy NET6 lab project. Yeah, that’ll do it.)
Summary and next steps
If you use GitHub Copilot regularly - especially agent mode - and you’ve ever wondered “what’s this actually costing me?” or “which sessions are burning through tokens?”, this dashboard will answer those questions. It’s free, self-hosted, and captures data Copilot already emits.
Setup takes about 5 minutes: clone the repo, docker compose up -d, add four lines to your VS Code settings, reload, done. You get three Grafana dashboards covering actual cost, usage patterns, and ROI analysis, all backed by proper observability backends (Tempo/Prometheus/Loki).
The repo is on GitHub: petender/GitHubCopilotDashboard. It’s MIT-licensed, so feel free to fork it, tweak the dashboards, or adapt it for your team. I’ve already got a few ideas for v2 (exporting cost data to CSV for monthly reports, alerting on overage thresholds, per-repo usage breakdown, port everything into an Azure-running dashboard with App Insights and Log Analytics), but the current version does what I need.
Give it a try and let me know what you think. And if you spot expensive workflows in your own usage, I’d love to hear about them - I’m still trying to figure out why some sessions cost 10x more than others. :)

Cheers!!
/Peter